


Unified social media API or 10 in-house integrations? Get the BCC cost model, every input to measure, where your data already lives, and the P&L view.
- A unified social media API replaces 10 platform integrations with one interface, while published build estimates span 40 to 460 hours per platform.
- Build cost rises with platform count and stops once you ship, and one connector hides 6 separate pieces of work.
- Coupling cost rises with platform pairs, so 10 platforms means 10 mappers but 45 cross-platform comparisons to defend.
- Churn cost never stops, running near 6 token expiry cycles a year per connected account, or a monthly proxy invoice.
- A worked 6 platform example lands near $143,000 in year one, with the build under half of it.
A unified social media API is the alternative to building each platform integration yourself, and the choice between the 2 is almost always priced wrong. Teams estimate the build, because the build is the part they can see and the only part that ever finishes.
What the estimate misses is everything the build leaves behind once it is done. With 10 integrations live you own 45 cross-platform comparisons that have to stay honest, roughly 6 token expiry cycles a year for every connected account, and a proxy bill that arrives whether or not anybody forecast it.
None of those 3 taper off as the code settles, because they grow with your platform count and your customer count instead. The more successful your product becomes, the more expensive the original decision turns out to have been.
If you have looked into this before, you have probably read 3 or 4 posts on it, and most of them are honest and useful as far as they go. They hand you an hours figure, a loaded hourly rate, and a multiplication to run.
They also stop at the same point, which is the moment the code ships. We may fall short somewhere ourselves, but this is an attempt at the whole picture rather than the first third of it.
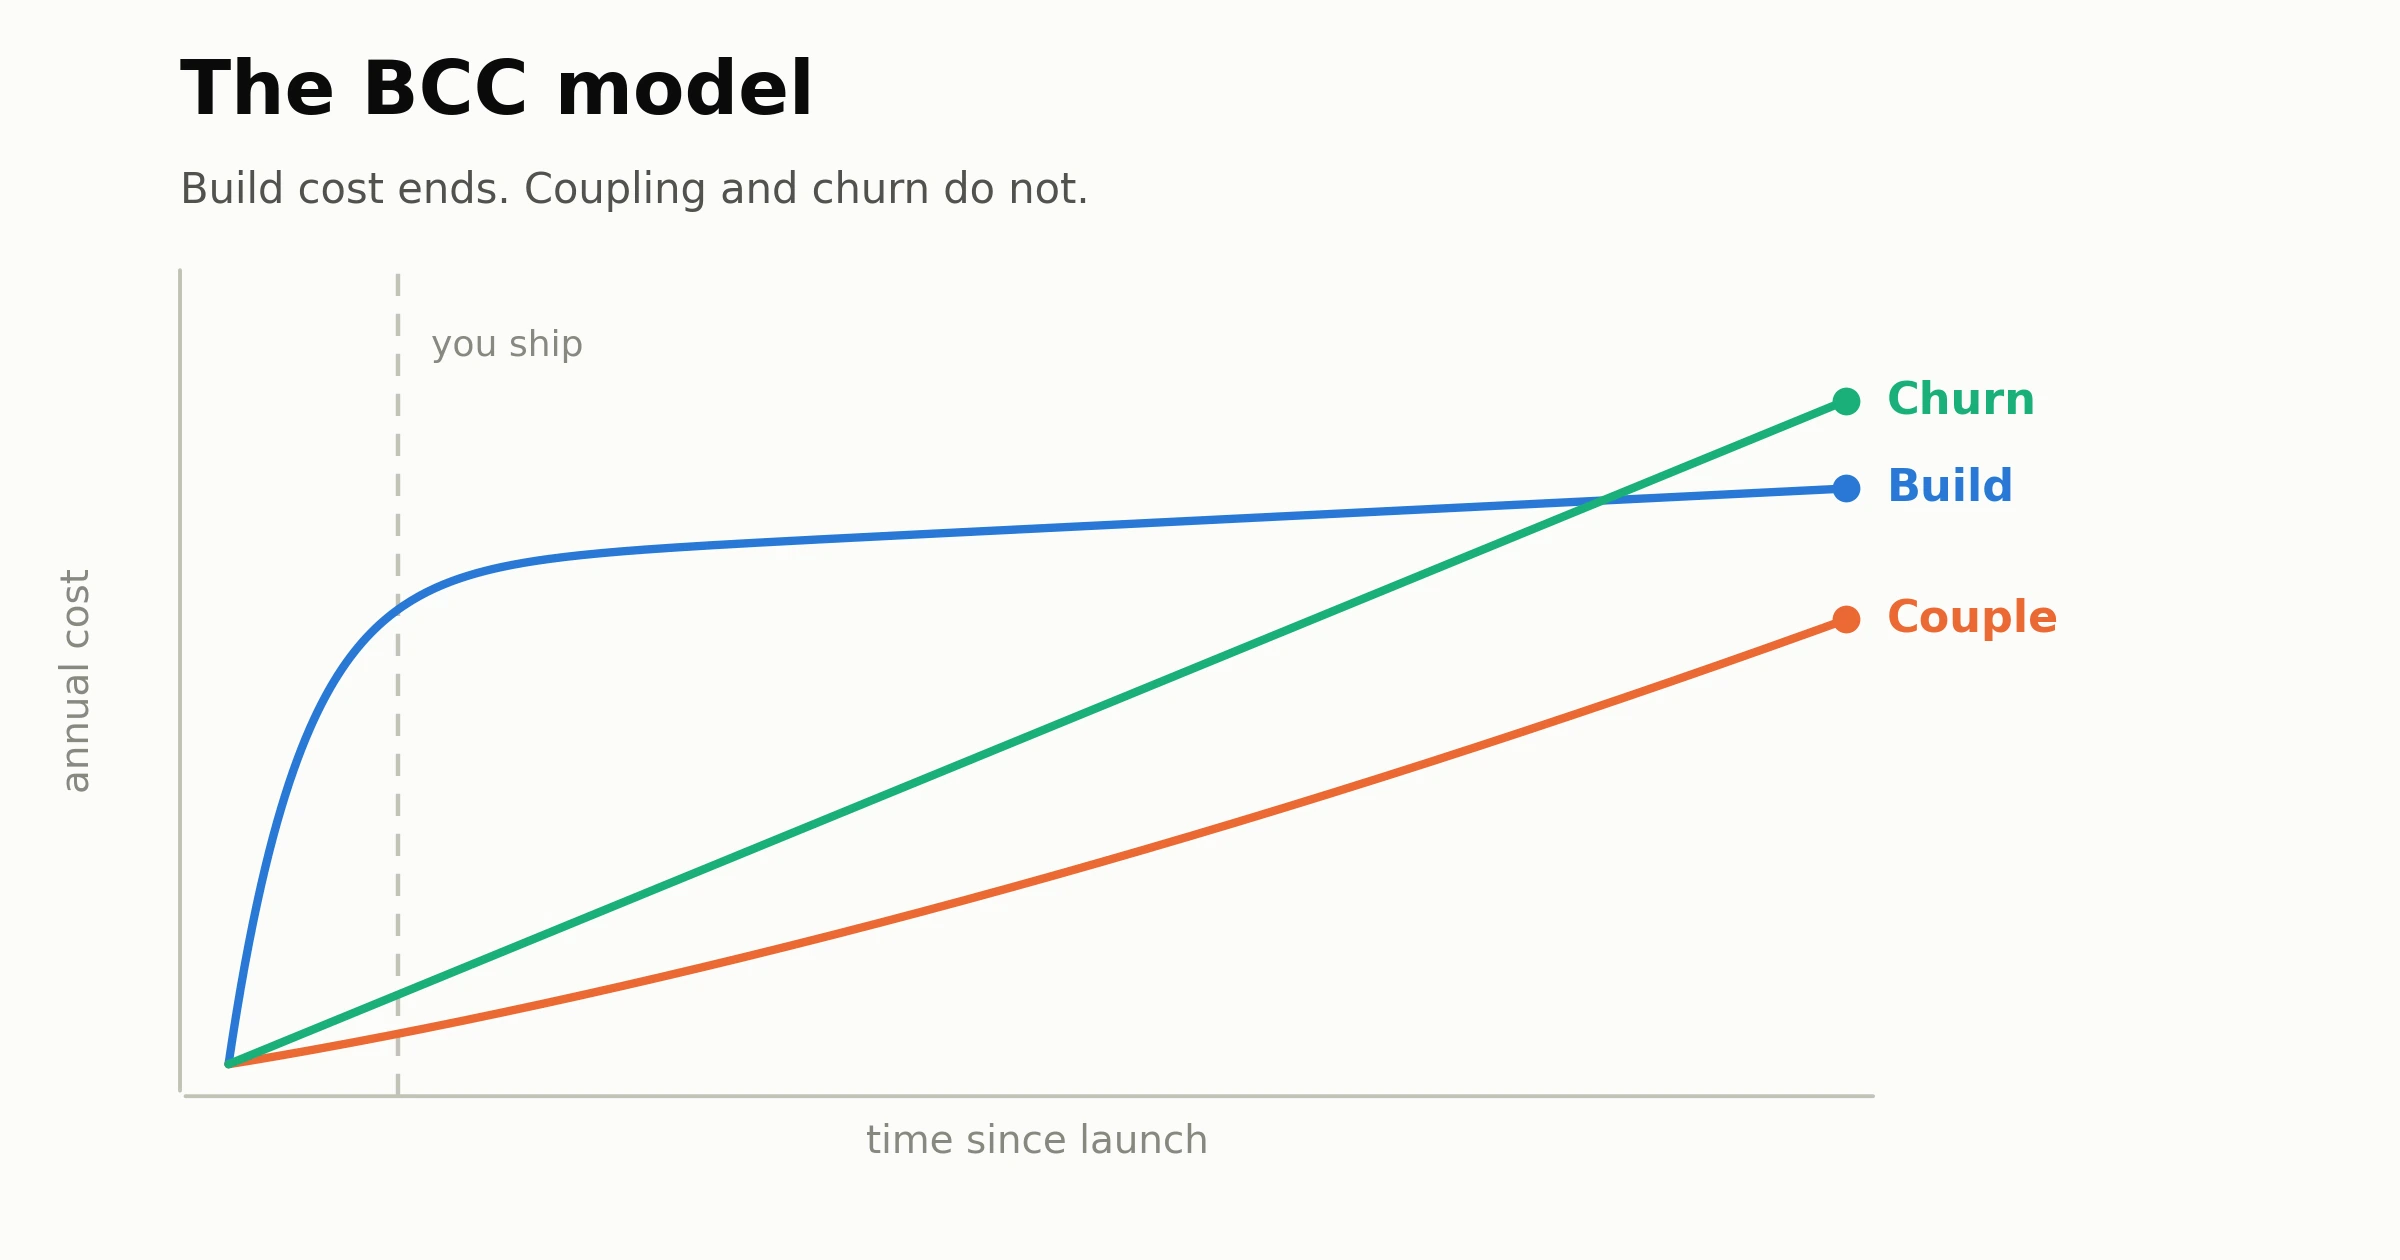
We call the 3 curves the BCC model:
- Build cost rises with how many platforms you support
- Couple cost rises with how many pairs of platforms you keep in agreement
- Churn cost is whatever it takes to keep data flowing once the build is done
That third curve behaves completely differently depending on whether you need consented creator data or public social data, so this page settles that question before it prices anything. After that comes the model itself, every input it needs, where your team already holds that data, and how your finance team will book each option.
If you have not decided between building and buying in principle yet, start with our build versus buy breakdown for creator platforms and come back here for the numbers.
Why most integration cost estimates stop at the build
1. The published range, and why it is too wide to use
Add up what is currently published on the cost of one social platform integration and you get 2 numbers:
- 40 to 460 engineering hours to build it
- $10,000 to $150,000 per integration per year to keep it running
A spread that wide is not really a range at all, it is an admission that nobody quoting those figures has measured the thing they are quoting.
2. Nobody who builds in-house publishes their hours
There is no reason a team would publish them, so every cross-platform figure in circulation comes from a company that sells the alternative to building. That includes us, which is why you should check the arithmetic on this page rather than trusting the conclusion.
What we can offer instead is one input you can verify yourself without taking anybody's word for it:
- The US Bureau of Labor Statistics puts the median annual wage for software developers at $133,080 as of May 2024, or about $63.20 an hour
- Add a 25 to 40% burden for benefits and payroll tax
- Divide by roughly 1,850 productive hours a year
- A loaded rate lands near $90 to $100 an hour
Every figure further down this page multiplies against a loaded rate like that one, so it is worth deriving your own before you carry on reading.
First, decide which social data path you are on
There are 2 ways to get social data, they carry completely different cost shapes, and most published estimates never say which one they assumed.
1. Consented creator data and public social data are different products
Consented data, also called authenticated data, means the creator logs in and grants your application access. You get verified private metrics in return, you usually need platform approval before you can ask for them, and you carry access tokens for as long as the account stays connected.
Public data means no login at all, so you read whatever happens to be publicly visible. There is no approval process and no consent flow, but there is also no versioned contract holding the platform to whatever it returned last month.
| Consented creator data | Public social data | |
|---|---|---|
| Creator has to connect | Yes | No |
| Platform approval needed | Usually | Usually not |
| Tokens to maintain | Yes, permanently | None |
| Coverage | Only creators who connect | Any public profile |
| Data depth | Full, including private metrics | Only what is visible |
| Contract stability | Documented and versioned | Often undocumented, changes without notice |
| Infrastructure you run | Token store, refresh and reminder jobs | Proxy pool, rotation, headless browsers, parsers |
| How failure announces itself | An error, immediately | A plausible zero, days later |
| Which curve dominates | Churn, driven by accounts | Churn, driven by volume, plus coupling |
2. Most platforms end up needing both
- Discovery runs on public data, because you cannot ask 10 million creators to connect an account before you can search them
- Verified campaign reporting runs on consented data, because public numbers will not survive an advertiser audit
- If you need both, you carry both cost shapes, which is the situation most creator platforms are in and almost no cost estimate models
3. Why this has to be settled before any number
The third cost curve behaves completely differently on each path, so an estimate that does not state which path it assumed cannot be used for planning. Providers split along the same line, with some covering only consented data and others only public data.
Phyllo covers both through one interface, which is why this page prices the 2 shapes side by side instead of picking one and ignoring the other. If you have not settled the question yet, our breakdown of authenticated versus public social data works through which one your product actually needs.
The BCC cost model: build, couple, churn
Every social integration cost sits on one of 3 curves, and published estimates measure the first while ignoring the other 2 entirely.
1. Build: this cost rises with the number of platforms
Here is what a single integration actually contains once you break it apart:
- Auth flow and token storage, or collection and change detection on the public path
- Data fetch and pagination
- Mapping the response into your own schema
- Error and rate-limit handling
- Tests
- Monitoring and alerting
That is 6 separate pieces of work rather than 1, and most estimates quietly price only the first 3 of them.
Approval time belongs on this curve too, even though it is calendar time rather than engineering time. On the consented path several platforms gate access behind a review, and while you wait your engineers are free but your launch is not.
A platform team we spoke with in July described going direct to 3 platforms as incredibly frustrating, and said they had to present their use case repeatedly before anybody granted access.
That delay shows up as postponed revenue rather than engineering hours, which is precisely why it never appears in an estimate. If you are deciding where to start, our guide to which platform to integrate first covers the approval order.
The build curve is a straight line, it can be estimated with reasonable confidence, and it eventually comes to an end, which is exactly why it is the one everybody publishes.
2. Couple: this cost rises with the number of platform pairs
You write one mapper per platform into your own schema, and that part of the work is linear in platform count. Most estimates get this right, because it is the part that looks like engineering.
What is not linear is the promise you make the moment those platforms share a schema. Every pair of platforms is a comparison somebody will eventually run, whether that is one creator on Instagram against the same creator on TikTok, or a campaign's reach on YouTube against LinkedIn.
Each of those pairs is a place where your semantics can quietly be wrong. Adding your 10th platform therefore adds 1 mapper and 9 fresh comparisons you now have to defend.
| Platforms | Mappers you write | Cross-platform comparisons you own |
|---|---|---|
| 3 | 3 | 3 |
| 6 | 6 | 15 |
| 10 | 10 | 45 |
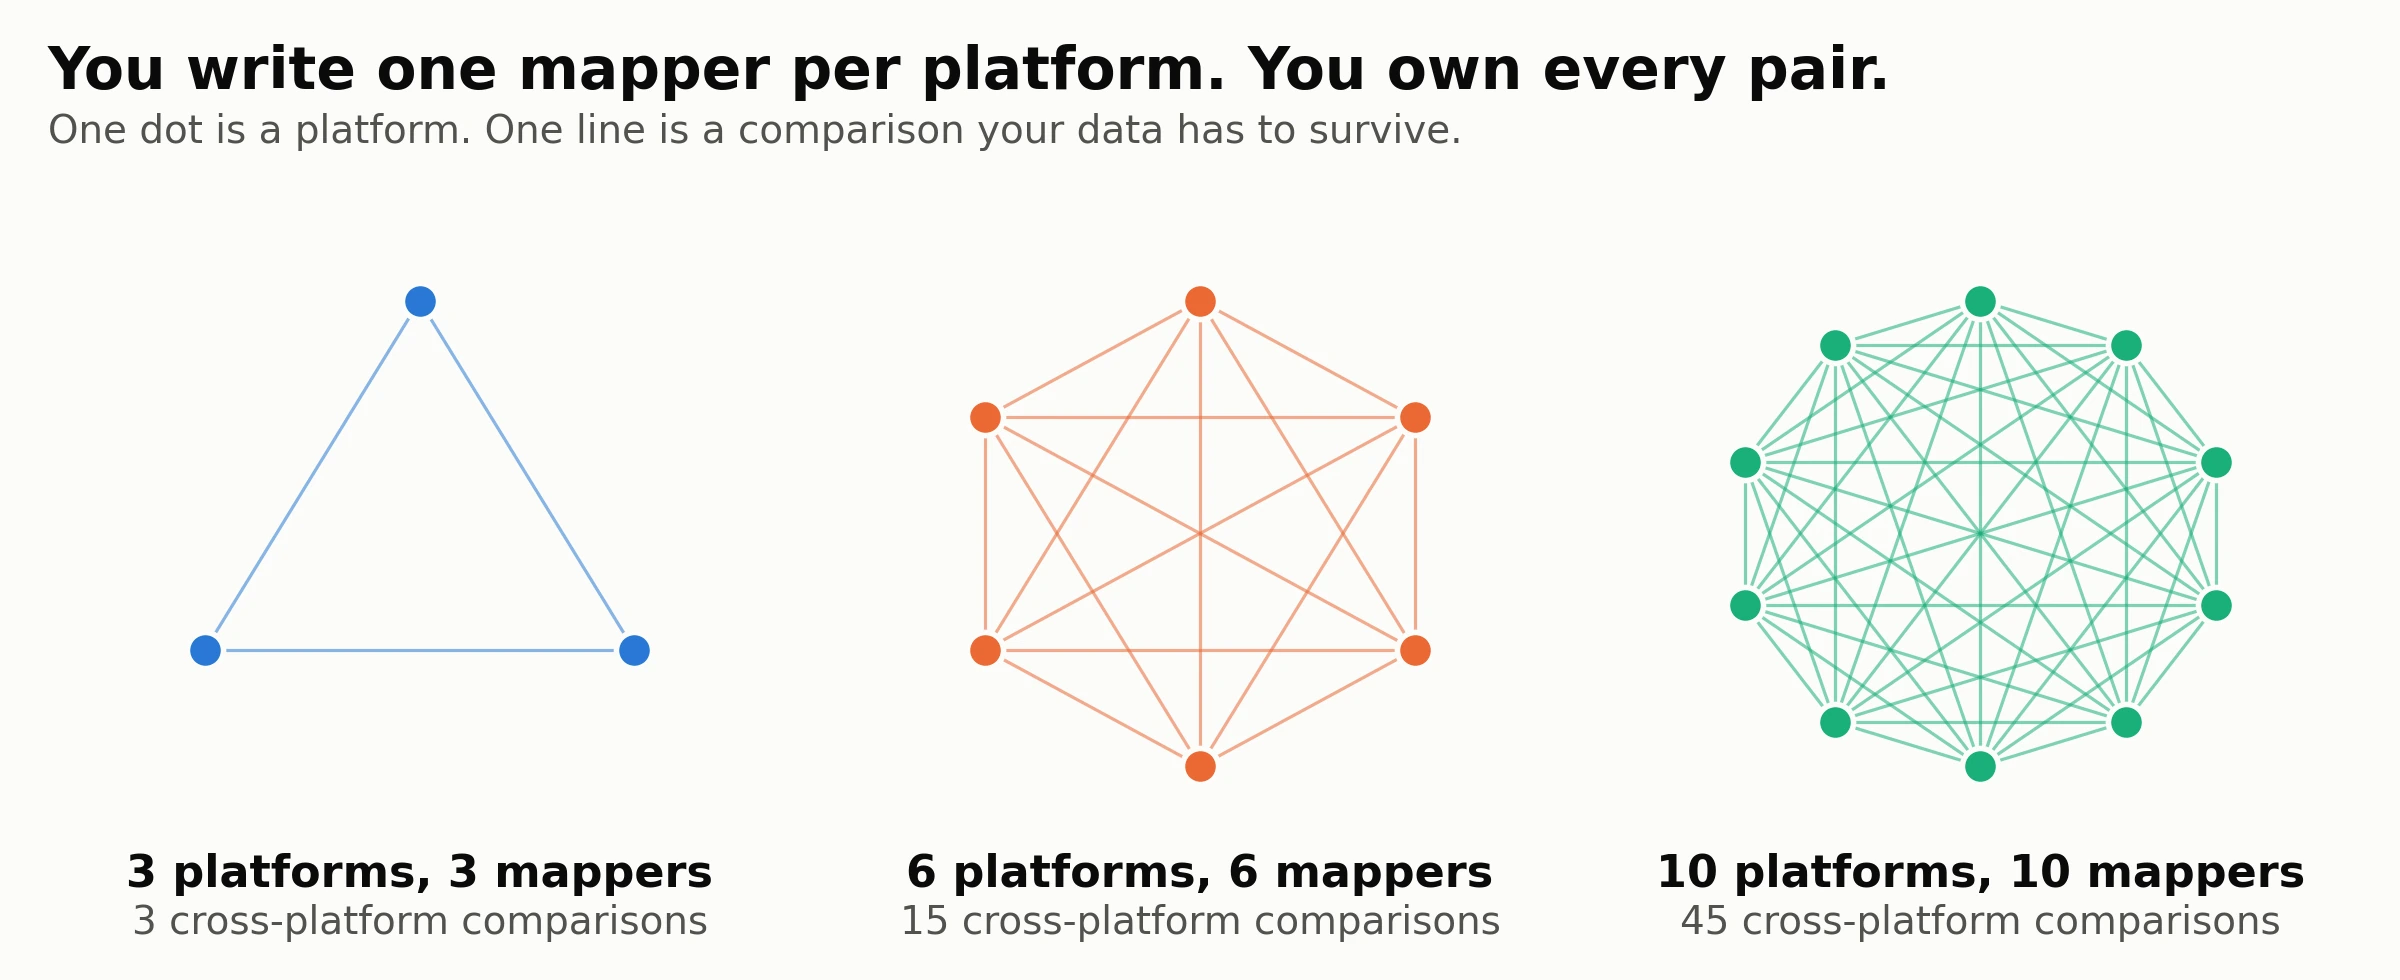
So 10 platforms means 10 mappers and 45 comparisons, and the 10 appears in everybody's estimate while the 45 appears in nobody's. The 45 is where the maintenance actually lives.
Here is what has to be reconciled before any of those comparisons hold up:
- A follower on one platform is not a follower on another
- A view is not a view
- Demographic granularity differs by platform
- Refresh timing differs, and one platform's "last 28 days" is another's "last 30"
One engineering lead put it plainly in June, telling us that a field either fits your schema or it is simply not in there. A different team told us in July that filters on 2 platforms behaved differently even inside a single unified interface, which is a useful reminder that a unified layer reduces coupling cost without removing it.
The curve fires on both data paths, and public data shapes are the less stable of the 2 by a wide margin.
Then there are the documents this curve produces without anybody planning for them. In 3 of the 4 platform teams we spoke with over the past few months, somebody had already built one of these:
- An internal wiki explaining the connection flow to their own staff
- A PDF teaching creators how to screenshot their own analytics
- A per-platform filter matrix
None of those appeared in a project plan anywhere, and each one exists to paper over a reconciliation decision that had no obvious owner. They are coupling cost with a filename attached.
3. Churn: this cost keeps arriving after you ship
Churn cost is whatever it takes to keep data flowing once the build is finished, and what drives it depends entirely on which data path you chose.
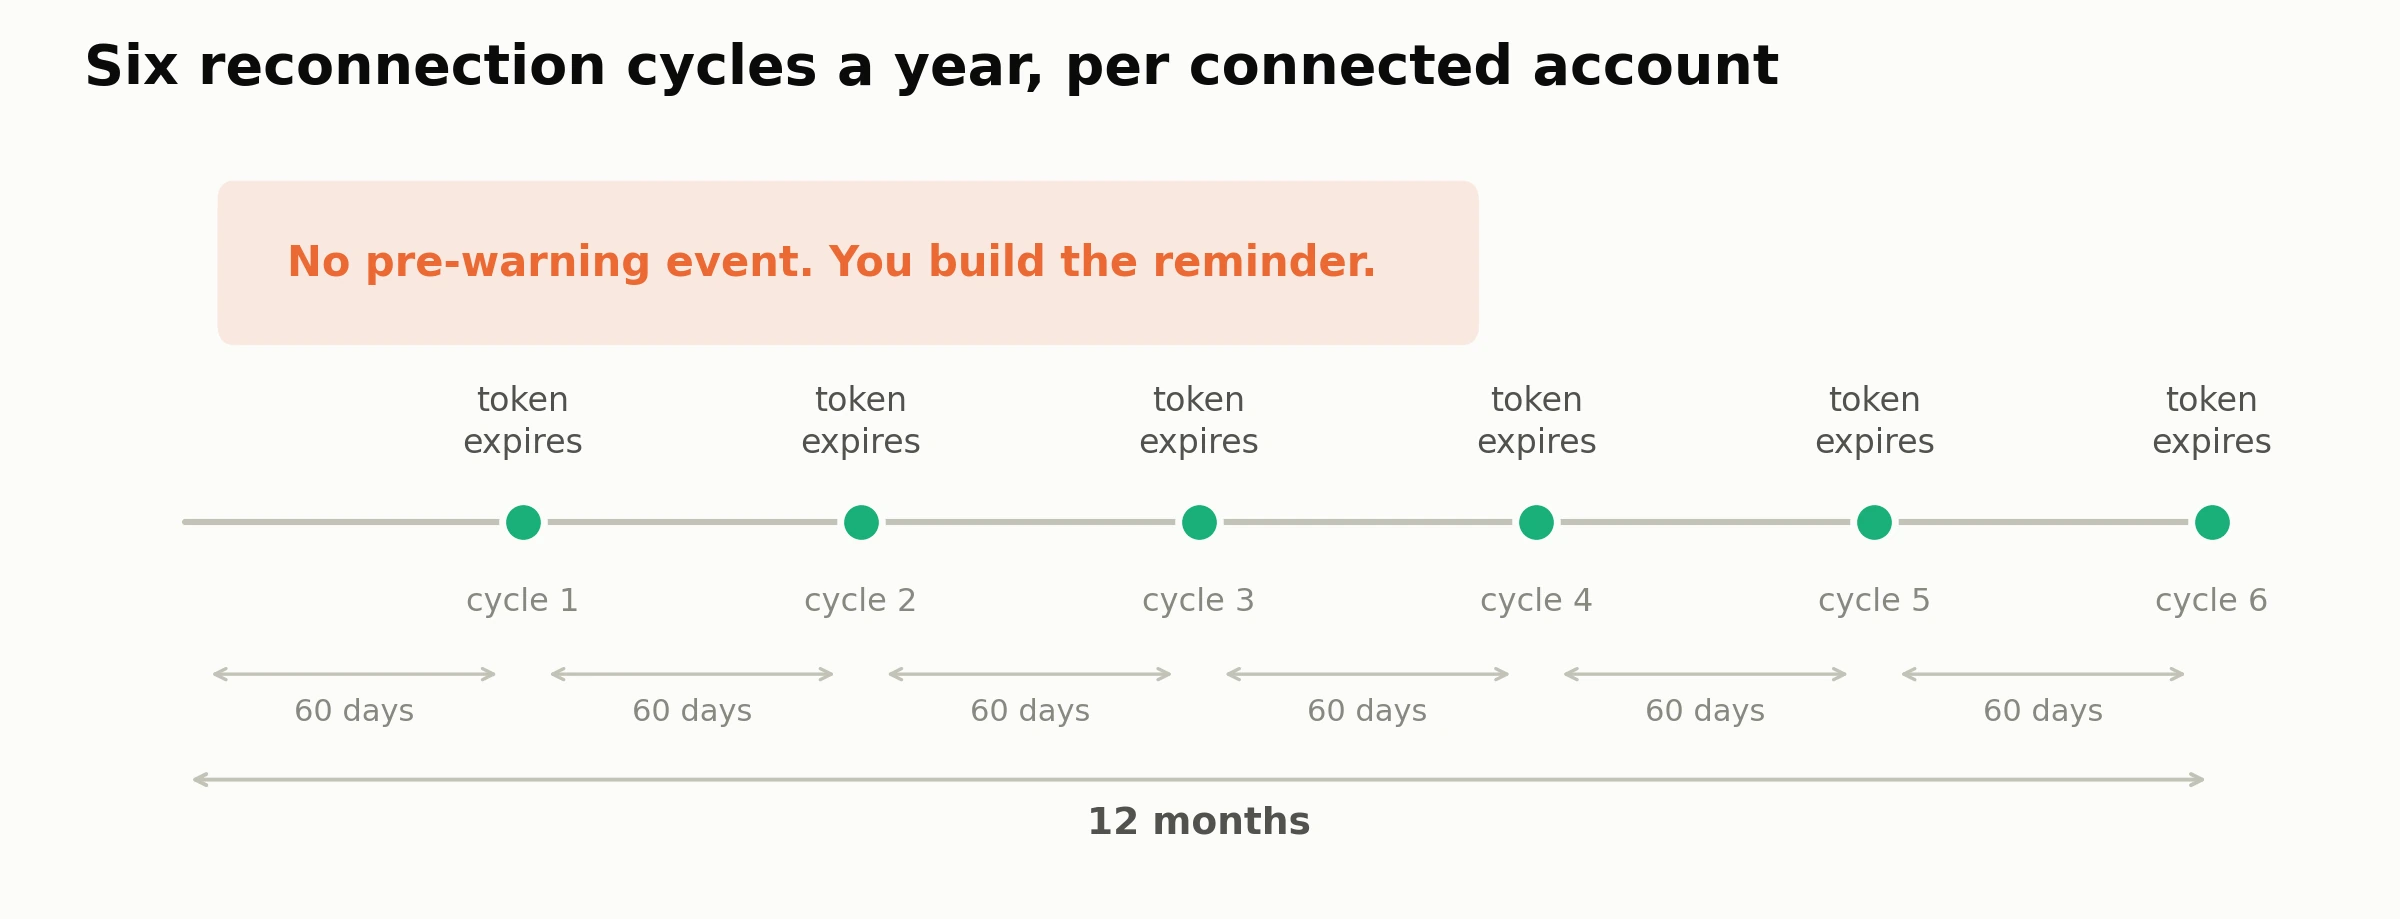
On the consented path, what breaks is the connection itself. Meta's own documentation states that a long-lived user access token generally lasts about 60 days, with no separate refresh token available.
When one expires the person has to go through the login flow again, and an expired token cannot be exchanged for a fresh one. That puts every connected account in scope for reconnection roughly 6 times a year, before you count password changes, logouts and revocations on top.
An engineering lead told us in June that no pre-warning event fires before a token expires, so in his words you would have to build that yourself. Their workaround was a 60 day timer and the hope that the reminder landed, and he described the whole thing as a problem they would deal with later.
That is not a careless team, it is what happens to any cost that has no line item anywhere in the budget.
On the public path, what breaks is the collection instead. There are no tokens, so none of the above applies to you, but what you run in their place is collection infrastructure and it is not free:
- Proxy pools: public endpoints rate-limit and block by IP, and residential proxies bill by the gigabyte, which makes this the largest line nobody forecast
- Rotation and ban handling: every block is a retry, a backoff, and a cost multiplier on a request you already paid for
- Headless browsers: anything rendered client side needs a browser fleet, which is compute billed per page rather than per API call
- Parser maintenance: a DOM or JSON shape changes, your parser stops matching, and nobody announced it in advance
- Compliance review: somebody has to decide what you are allowed to collect, then revisit it whenever the terms change
Most of that is not engineering hours at all, it is a monthly invoice plus an on-call rota, which is exactly why it never shows up in an hours-based estimate.
The failure mode that costs the most on this path is the quiet one. A broken token throws an error and you know about it within minutes, whereas a broken parser returns an empty array and empty looks identical to a real zero.
A creator's follower count reads 0, your dashboard renders it without complaint, and you find out when a customer asks why the number looks wrong. Silent failure costs more than loud failure, and the public path is where silent failure lives.
This curve scales with request volume and elapsed time rather than with connected accounts, so it climbs even if you never add another platform.
Here are both shapes set against each other:
| Consented path | Public path | |
|---|---|---|
| What breaks | Tokens expire, users revoke | Endpoints, response shapes, proxies, parsers |
| What you build | Reconnection prompts, expiry reminders | Proxy rotation, browser fleets, parsers, backfills |
| What you buy monthly | Nothing extra | Proxy bandwidth, browser compute, CAPTCHA solving |
| What it scales with | Connected accounts | Request volume and time |
| Warning you get | Sometimes a changelog | Usually nothing |
| How you find out | An error, or a support ticket | A number that looks wrong to a customer |
On one path your connections break and on the other your collection breaks, and either way something fails every month while somebody gets paid to repair it.
4. Which curve is deciding your build-versus-buy call
| Few platforms (1 to 3) | Many platforms (6+) | |
|---|---|---|
| Few accounts or low volume | Build, because coupling and churn barely exist yet | Coupling-dominated, so your cost is mapping rather than connectors |
| Many accounts or high volume | Churn-dominated, so your cost is reconnections and support rather than connectors | Both curves compound, and the arithmetic stops being close |
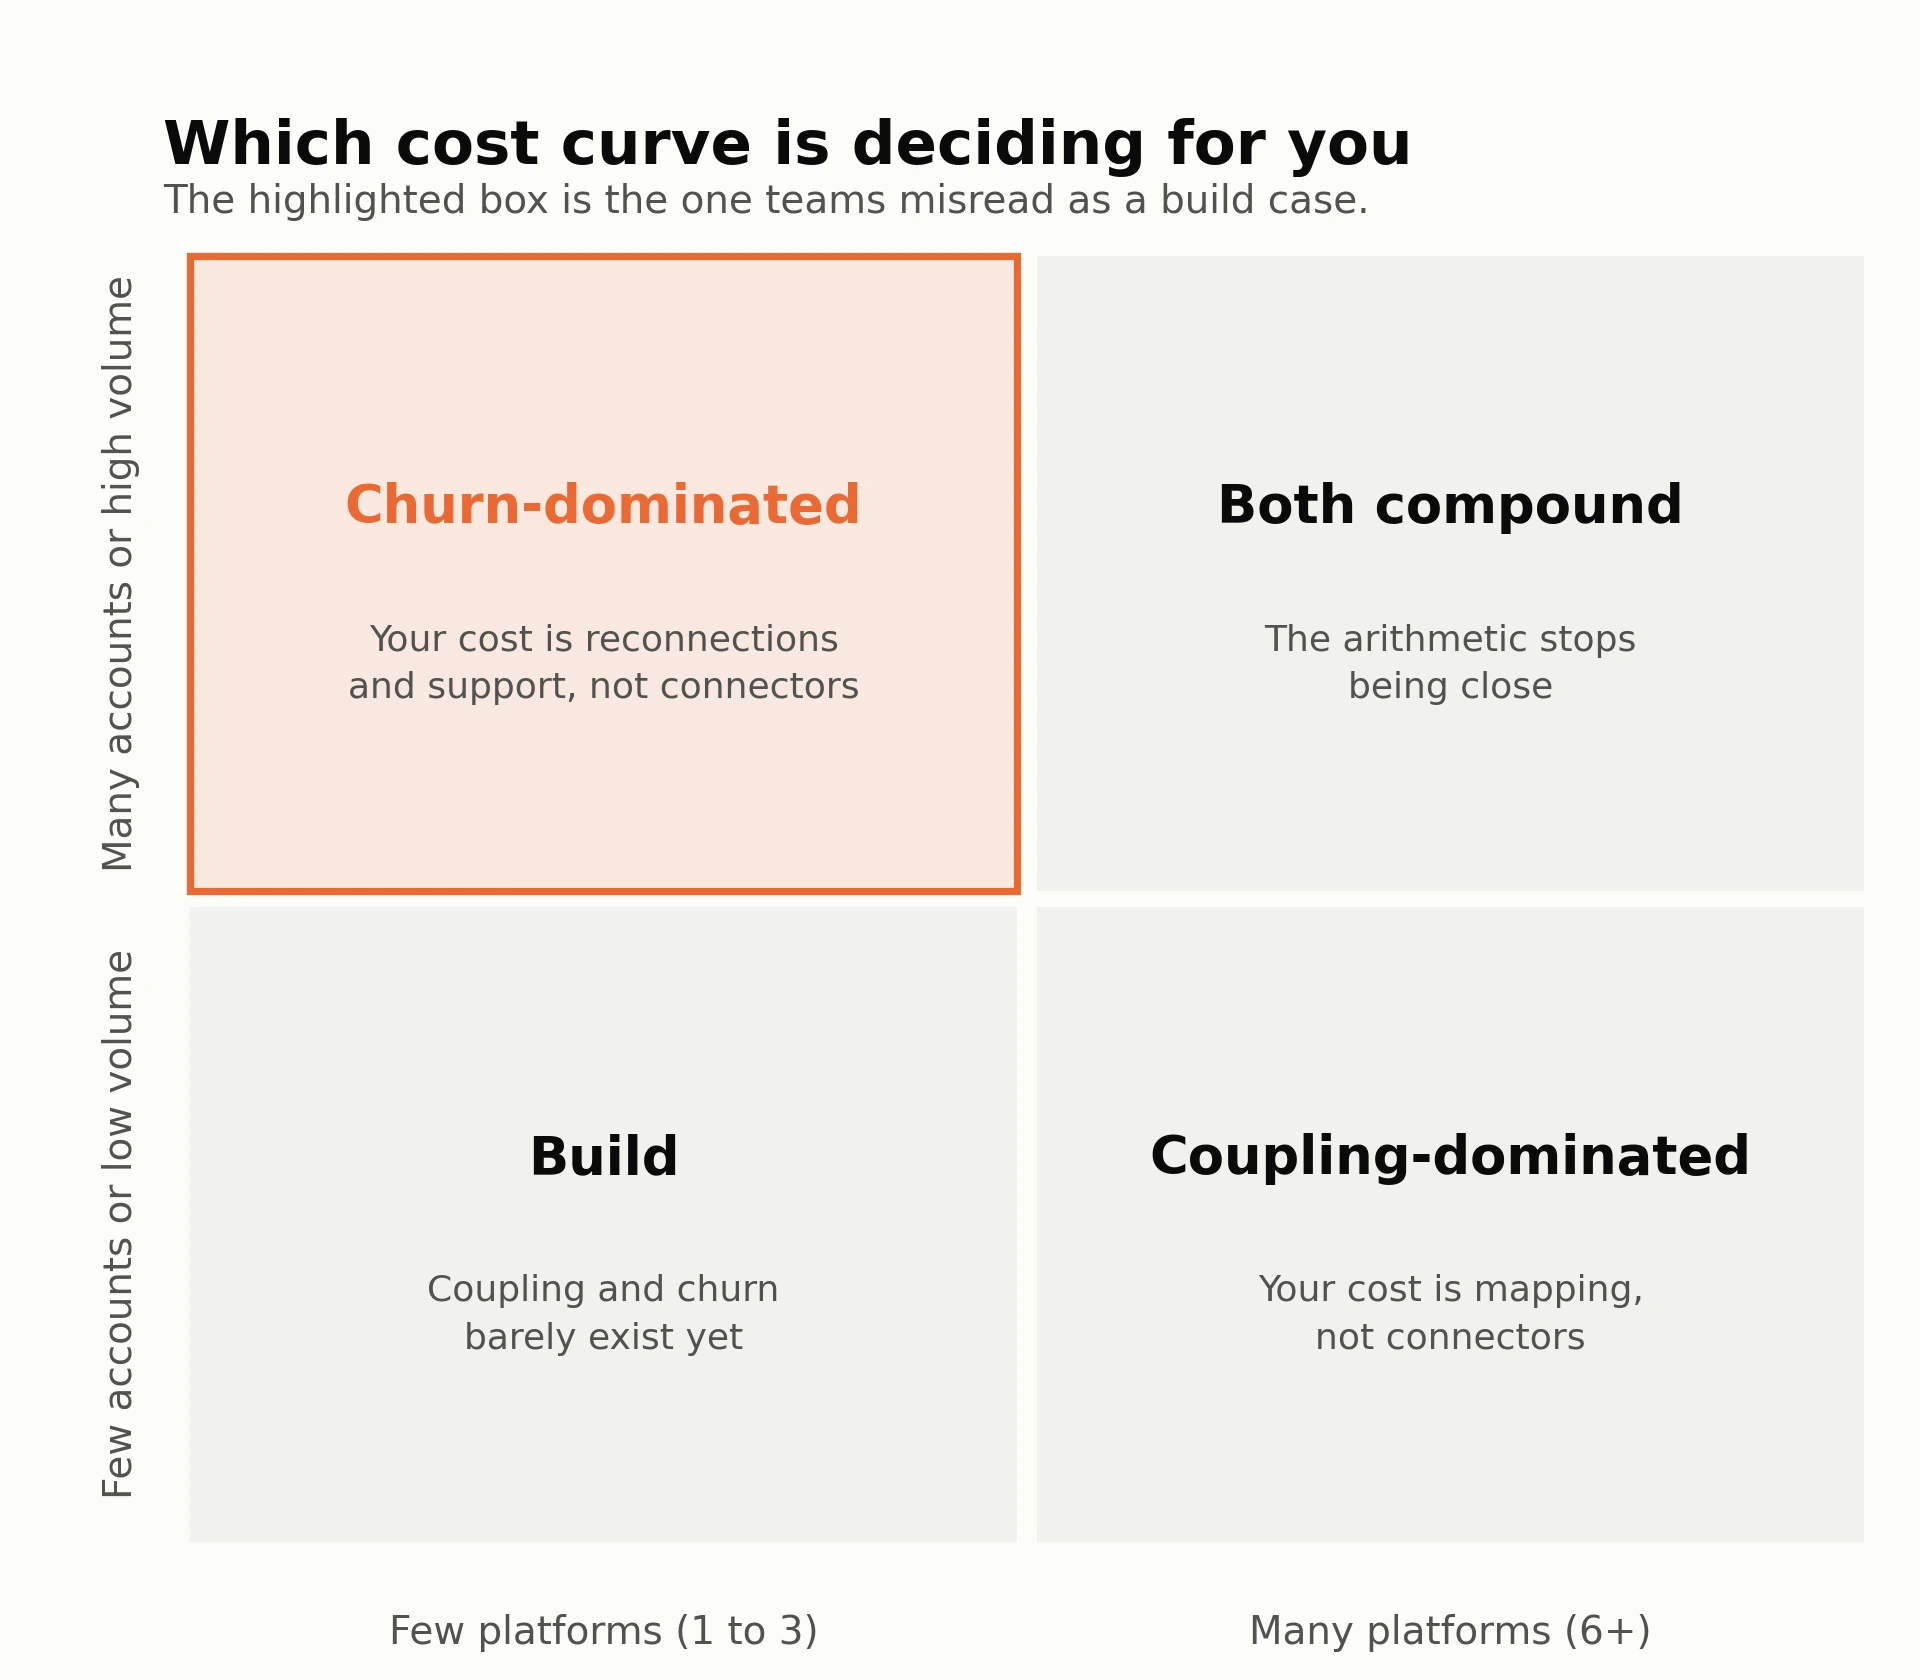
The bottom-left box is the one nobody warns people about in advance. A consumer app on 3 platforms with 40,000 connected accounts assumes it is a build case because the platform count is low, when its entire cost is actually churn.
Buying, for that team, is not really buying connectors at all. It is buying the machinery that keeps 40,000 connections alive.
5. The 3 thresholds, and the first one you cross decides
- Platform count in 18 months, taken from the roadmap rather than today's list
- Connected accounts or request volume at plan, taken from the model your board approved
- Breakage you can absorb per quarter without missing roadmap commitments
What to measure, and where your team already has the data
Every input below is data your team already owns, so this section is mostly about telling you which system it is currently sitting in.
1. Build inputs and their sources
| What to measure | Where you already have it |
|---|---|
| Loaded engineer rate | Payroll: base pay plus a 25 to 40% burden, divided by ~1,850 productive hours |
| Build hours per connector | Jira or Linear: cycle time on the last connector epic you shipped |
| Platforms in scope | Your 18-month roadmap, not today's list |
| Approval wait per platform | Platform partner documentation, plus your own submission history |
| Security and compliance review | Your release checklist, or your SOC 2 evidence log |
| Revenue delayed by approval | Finance: pipeline tied to that platform, divided by weeks to launch |
The line most teams leave out is the last one, and while it is not an engineering cost it is still money leaving the business.
2. Coupling inputs and their sources
| What to measure | Where you already have it |
|---|---|
| Platform pairs | Arithmetic: platforms × (platforms − 1) ÷ 2 |
| Reconciliation hours per pair | Git history on your schema or mapper directory |
| Schema changes shipped per quarter | Commit log on your normalisation layer |
| Breaking changes absorbed per platform | Each platform's own changelog, plus your incident log |
| Artefact upkeep | Ask whoever owns the internal wiki or capability matrix |
| Data-mismatch support tickets | Your helpdesk, filtered to your reporting or data tag |
There is no public benchmark for breaking changes per platform per year, every vendor asserts a figure, and none of them has published a count to back it up.
So go and count them yourself, because these 4 sources are all public and all dated:
- Meta Graph API changelog
- TikTok developer products changelog
- YouTube Data API revision history
- LinkedIn Marketing API recent changes
An afternoon spent reading those beats anybody's estimate, ours included. If you want the per-platform picture before you start counting, our platform-by-platform API comparison covers what each one exposes and how often it moves.
3. Churn inputs and their sources
| What to measure | Where you already have it |
|---|---|
| Connected accounts (consented) | Your own database |
| Token lifetime per platform (consented) | Each platform's auth documentation |
| Reconnection events (consented) | Auth logs: refresh failures plus explicit revocations |
| Reconnection completion rate (consented) | Your funnel: prompts sent against reconnections finished |
| Support minutes per failure (consented) | Average handle time on your connection-issue tag |
| Request volume (public) | Your own logs |
| Proxy spend (public) | Your proxy vendor invoice, per GB or per request |
| Block and ban rate (public) | Collector logs: non-200 responses, split by platform |
| Headless browser compute (public) | Your cloud bill, or your scraping vendor invoice |
| Parser fixes shipped (public) | Commit log on your parser or extractor directory |
| Silent-zero incidents (public) | Data quality alerts, or tickets saying a number looks wrong |
| Coverage gaps (public) | Your own spot checks against the live platform |
None of that requires a vendor, since it lives in your logs, your helpdesk, your cloud bill and your database.
One warning about the public path is worth stating plainly. Proxy and compute spend is the only line in this entire model that arrives as a real monthly invoice rather than an internal cost allocation, which makes it the easiest number to find and the one most often left out of the comparison, because it lands in a different budget from engineering.
Run the model, and how your finance team will book it
1. The BCC worksheet
| Curve | What to count | Your figure |
|---|---|---|
| Build | Platforms × build hours × loaded rate | |
| Build | Approval weeks × revenue at risk per week | |
| Couple | Pairs × reconciliation hours × loaded rate | |
| Couple | Artefact upkeep hours per month × 12 × loaded rate | |
| Churn (consented) | Accounts × expiry cycles × support rate × minutes | |
| Churn (public) | Monthly proxy and compute spend × 12 | |
| Churn (public) | Parser fixes per quarter × hours × loaded rate |
2. A worked example, with every assumption stated
Here are the assumptions, all stated openly so that you can disagree with any of them:
- 6 platforms, consented path
- Loaded engineer rate $95 an hour, loaded support rate $45 an hour
- 120 build hours per connector, 8 reconciliation hours per pair
- 12,000 connected accounts, a 60-day token window
- 92% of expiries resolving without a support touch
Adding those assumptions together, year one works out like this:
- Build: 6 × 120 hours × $95 = $68,400
- Couple: 15 pairs × 8 hours × $95 = $11,400
- Churn: 12,000 accounts × 6 cycles = 72,000 expiry events. At 8% needing help, that is 5,760 support touches at 12 minutes each, or 1,152 hours at $45 = $51,840
- Reconnection tooling upkeep: 120 hours × $95 = $11,400
The year one total comes to roughly $143,000, and the build accounts for under half of it.
By year 3, at 8 platforms and 28,000 connected accounts, the build line drops to 2 new connectors while churn roughly doubles. The total lands near $172,000 a year, and almost none of that figure is the build.
If you are on the public path instead, swap out the churn line and rebuild it from your own invoices. Take proxy and browser compute for 12 months, add parser fixes at your loaded rate, then add the engineering time spent on rotation and ban handling.
The shape of the answer stays the same on either path, and all that changes is whose invoice it arrives on.
3. Convert the total into headcount
Year 3 carries roughly 2,900 recurring hours, and dividing that by about 1,850 productive hours gives you 1.6 full-time engineers, permanently, shipping no features.
That sentence tends to move a meeting faster than any dollar figure does. For a 3-year comparison, ask finance for the discount rate they already use and state it alongside the total.
4. Where each option lands on the P&L
This is the part engineering estimates never cover and the part finance always asks about first.
| In-house build | Provider subscription | |
|---|---|---|
| Where it sits | Engineering payroll, usually R&D | A subscription line, often cost of revenue |
| Capitalisable? | Some application-development-stage work may qualify under ASC 350-40 for internal-use software | Generally expensed as incurred |
| Gross margin effect | Often below gross profit, so margin looks untouched | Often inside cost of revenue, so it reduces margin directly |
| Year-one EBITDA | Capitalising can flatter year 1, then amortise for years after | Hits the current period in full |
| Reversible? | No, the engineering time is sunk | Yes, you can cancel or renegotiate |
2 options carrying the same cash cost can still show different gross margins, because provider fees usually sit in cost of revenue while engineering salaries usually do not. If your board watches gross margin, the accounting treatment is part of the decision rather than an afterthought to it.
We are not accountants, and the treatment depends on your auditor, your stage and where you file. Take the classification question to your finance team before you take the total to your board.
5. The commercial cost of getting the data wrong
- One team told us in July that their own first-party data showed an 81% female audience where their vendor tool showed 77%, and on that brief the creator lost the campaign
- Another team we spoke with in July said their demographics have to be accurate to within 5% or their platform's credibility goes with them
Neither of those appears as an engineering cost on any budget line, and both of them are revenue.
6. What to do when you cannot fill a cell
Say so, and then bound it with an explicit range. A stated range with a stated assumption is worth more than a confident number, and it survives the follow-up question in a way that false precision never does.
What a unified social media API changes, and what it does not
1. It removes the build curve, per platform
You skip the build entirely, along with the approval wait on any platform where the provider already holds access.
2. It reduces the coupling curve but does not remove it
You map one schema into your own, once, instead of owning 45 comparisons you defined yourself. The provider carries the pairwise semantics from that point onward.
The honest limit is that no provider can return a field the platform does not expose, so platform gaps remain platform gaps regardless of who you buy from.
3. The churn curve mostly stays with you
- On the consented path, you still own the reconnection prompt your creators see. A provider can tell you a connection has dropped, but only you can persuade the creator to fix it
- On the public path, a provider absorbs the part that is a monthly invoice, meaning proxy pools, rotation, browser fleets and parser upkeep. You still own the consequences of a coverage gap in front of your customer
Our own customers are the ones who say this, which is why it sits here rather than in a footnote.
4. The cost you take on instead
What you take on instead is a subscription with a shape, and per-connection, usage-based and flat-rate pricing scale very differently as you grow. Per-connection pricing in particular puts you back on the churn curve, just on somebody else's meter, so model it at your plan numbers rather than today's.
The case for a unified layer is not that it always comes out cheaper, because sometimes it does not. It is that 3 cost curves with 3 different drivers become one line item with a known shape, and a known shape is something you can plan against.
Whether that trade is worth making depends on numbers only you hold, which is why this page spent most of its length telling you where to find them. Phyllo's platform coverage and pricing is the place to check the trade against your own use case.
When building your own integrations is the right call
1. When the data is something no provider will ever hold
One team described cross-referencing a location layer of creator home addresses against age filters, in order to answer a single brand brief. No provider holds that data today and none of them is going to build it.
If your differentiator is a dataset nobody else models, then build it, because that is the entire point of building.
2. When you have few platforms, low volume and stable requirements
This is the top-left box of the grid, meaning 2 or 3 platforms, a few hundred connected accounts, and no near-term plan to add more. Buying at that stage solves a problem you do not have yet.
3. When you need one platform's long tail
A normalised layer is a ceiling as much as it is a floor. If your product depends on one platform's deepest and strangest endpoints, go direct for that platform and use a provider for everything else.
The same company, 3 years later
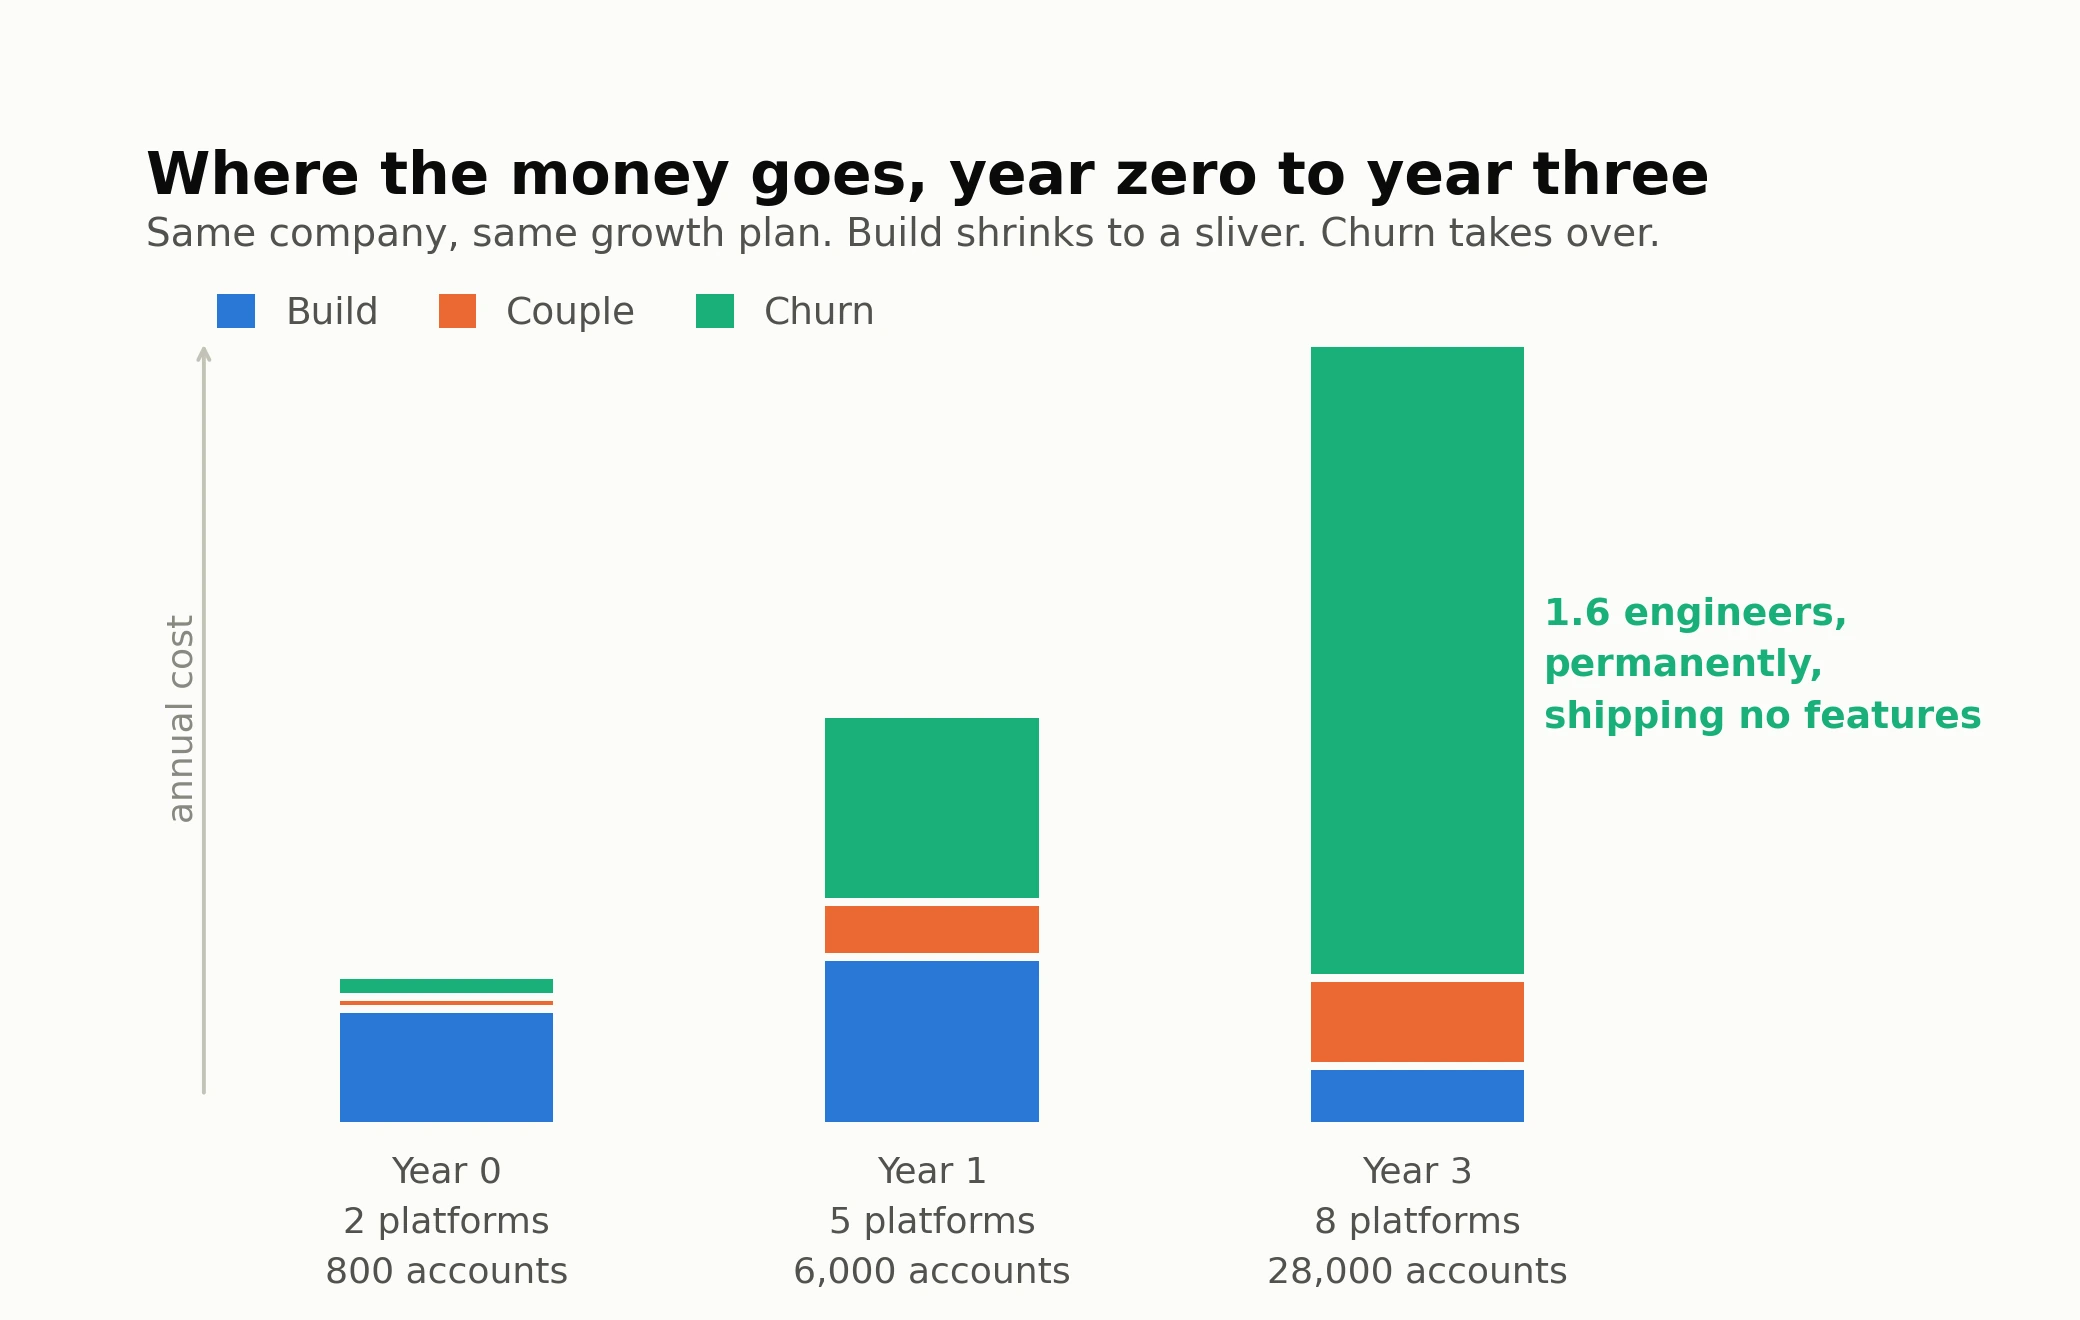
What follows is arithmetic rather than a case study, and every figure in it comes from the tables above.
1. Year 0: 2 platforms, 800 connected accounts
The team shipped 220 hours of work inside a single quarter, and everybody agreed that building had been obviously right. At that size they were correct, with one pair to reconcile and churn nowhere near visible yet.
2. Year 1: 5 platforms, 6,000 accounts
There are 10 pairs to keep honest now, and somebody has started a spreadsheet recording which field means what, because 2 engineers keep giving different answers to the same question.
The first reconnection tickets arrive around the same time, logged as support volume rather than integration cost, so nobody notices the second curve beginning to climb.
3. Year 3: 8 platforms, 28,000 accounts
There are 28 pairs now, tens of thousands of expiry events a year, and the 2 engineers hired to build the product spend most of a week each keeping connectors alive.
That works out at roughly 1.6 full-time engineers, permanently, on work that ships no features to anybody.
4. The point
Nothing went wrong here and nobody made a bad call at any stage. They hit their growth plan, and hitting it is precisely what made the original decision expensive.
The build decision was correct in year 0 and was never revisited afterwards, because no line item on any budget ever said integrations.
What you are actually deciding
You are not deciding whether your team can build 10 social integrations, because they can, and so can any competent backend team. What you are deciding is what 2 of your engineers will be doing in 3 years' time.
The build is a quarter of work, while the maintenance is the rest of your company's life. It grows on 2 curves you do not control, which are how many platforms your roadmap adds and how many accounts your growth plan connects.
In the Stack Overflow Annual Developer Survey 2024, 62% of developers named technical debt their single biggest frustration, ahead of every other answer. Unowned integration maintenance is where a great deal of that debt ends up living.
So the argument is not that building is hard, it is that building is finite while owning is not. That distinction is the line Phyllo exists to sit on.
One interface covers public social data and consented creator data across every major platform, with the connectors, the platform approvals, the token lifecycles, the proxy and collection infrastructure and the schema reconciliation all held on our side of it. You keep the part that is genuinely your product, and you stop keeping the plumbing underneath it.
We would rather you arrived with a model than a hunch, so run these numbers against your own payroll, your own Jira, your own auth logs and your own proxy invoice. If the arithmetic tells you to build, then build, and tell us we were wrong.
If it tells you the churn curve is about to become somebody's full-time job, that is the conversation worth having with us. If you would rather work through the model against your own platform list and account volume with somebody who has seen it a few hundred times, schedule a demo and we will do it together.
Sources: US Bureau of Labor Statistics, Occupational Outlook Handbook, median annual wage for software developers, May 2024. Meta Graph API changelog and Facebook Login access token documentation, both read 13 August 2026. Stack Overflow Annual Developer Survey 2024. ASC 350-40 guidance. Customer observations are drawn from 4 sales and success conversations held in June and July 2026, anonymised.
How much does it cost to build a social media API integration?
Published estimates span 40 to 460 engineering hours per platform, too wide to plan against. Use your last connector's cycle time from Jira against a $90 to $100 loaded rate.
Is a unified social media API cheaper than building in-house?
Not always cheaper, but far more predictable. Buying removes the build curve and shrinks coupling, adding a subscription instead. Below 3 platforms at low volume, building wins.
Do I need authentication to get social media data?
Not for public profiles, posts and follower counts, which are visible without a login. Verified private metrics like audience demographics and story views need creator consent.
What does it cost to run your own social media scrapers?
More than the engineering, and it lands in a different budget. Public collection bills monthly for proxy bandwidth, browser compute and CAPTCHA solving, plus parser fixes.
What is the best social data API for public and authenticated data?
Judge coverage of both paths, platform count, who absorbs proxy and token upkeep, and whether the schema is normalised. Phyllo covers both across every major platform.